
Dynamic monitoring of key figures for SMEs and connected networks
Create indicators and dashboards to understand your business and improve decision-making.
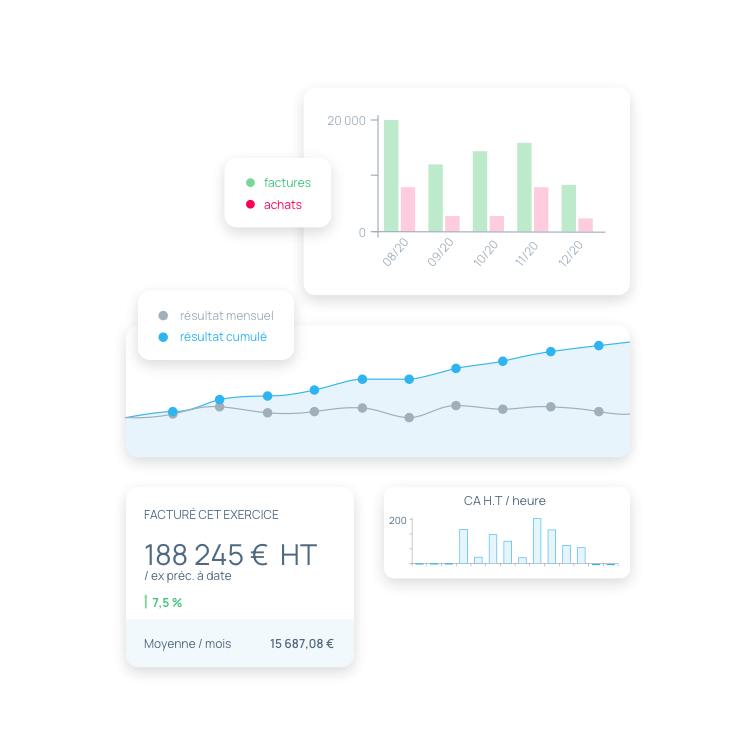
Customized dashboards <br>to analyze, make decisions and develop your business.

Integrated indicators
Forecasts, sales, expenses: find out your key data and trends, and adjust your strategy.

Customized reporting
Create the indicators that really matter to you. Make the right decisions at the right time!

Managing the unexpected
Identify late payments or budget deviations before they impact your cash flow
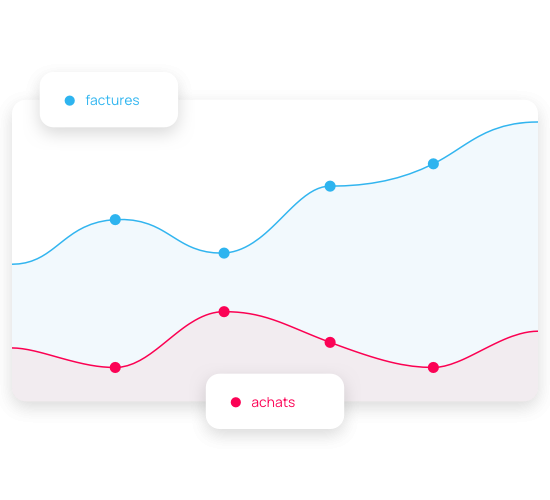
Track your favorite management indicators
incwo's integrated dashboards give you complete business visibility
- Sales figures
- Sales by volume and value or unpaid bills
- Budgets and expenses or cash flow.
Customize your indicators with our Analytics tool for real-time monitoring and agile decision-making.
Customize your business reporting
With the Analytics function, use the power of incwo's DATA to measure your success.
- Identify your TOP 10 customers or your TOP 50 best-selling products
- Track the satisfaction rate in response to your support tickets.
- View your sales figures by day, month, year or . Compare them with the previous period. And much more ...
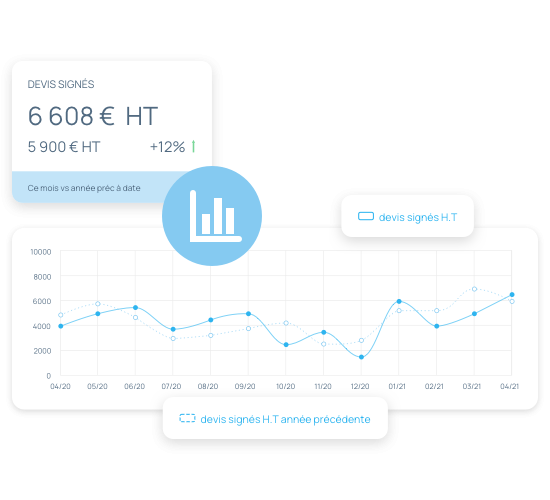
Activate the connection between incwo and Microsoft PowerBI
Go to Microsoft PowerBI and add incwo as a data source: all incwo data accessible via the API can be selected. The data is updated automatically, and once the sources have been set, you don't need to do a thing.
Every company is unique
Customize incwo with the applications you need

Analytics
Drive your business with data
- BASIC or higher
Multi-channel sales analysis
Analyze your daily sales by channel
- BASIC or higher
Activity reports
Quickly prepare your activity reports
- UNLIMITED or higher

Dashboards
Compose your own activity tracking charts
- UNLIMITED or higher
I've been using it for more than ten years now. The system works very well, support is responsive, at a price that remains very reasonable...
 Christophe AgnusOpinion collected on Facebook
After weeks of research and testing, we chose it. Why? Scalable, complete and above all excellent value for money for several users, plus an available customer service that solves your issues quickly!
 Franck NolorguesOpinion collected on Google
One word COMPLETE, simple to use, you can manage everything on the same platform. You can access it anywhere, and work with ease.
 Brice PrivatOpinion collected on Facebook
It was hard for me to find a 100% cloud ERP to manage my invoices & quotes and my partner or wholesaler relationships. It stood out from every other offer currently available on the market...
 Starcom MultimediaOpinion collected on Google
Very good ERP for small businesses, especially for iPad cash register, product catalog management and inventory management.
 Pierre AntonioOpinion collected on Facebook
An entrepreneur for more than 6 years, I use it for my invoices and to track my cash flow. This software is easy to use and saves me precious time when invoicing my customers
 Pegguy KONOOpinion collected on Google
Great software, once everything's set up, it saves a lot of time. What's more, it's really customizable, and when you have a question, the team responds quickly. I'm happy with the choice.
 Elodie SalbanOpinion collected on Facebook
I've been using the service for almost 10 years, quality service, professional, clear and easy to use, a real trustworthy tool for management and invoicing, I recommend ++++
 Damien MazaudouxOpinion collected on Google
Great software, I don't think I could do without it! Saves me a lot of time, and the service is always friendly and welcoming.
 Geoffrey RieraOpinion collected on Facebook
We've been using Incwo for several years now, as it's an excellent CRM SaaS solution for its quality/price ratio. It's a highly customizable platform with hundreds of apps available to adapt the service to the needs of each company in our group ...
 Elodie SgsOpinion collected on Facebook
15-day free trial
Find out how incwo helps you manage your business
- without obligation
- NF-certified software
- Expert accountant access included