Do you use campaigns to manage your sales prospecting? Do you need to analyze the evolution of your prospects or customers in your pipeline? Would you like to track the impact of your sales or product changes?
With this app, you can use the cohort technique to analyze the effectiveness of your sales campaigns.
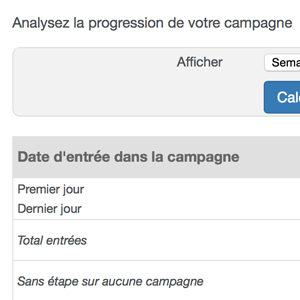
This app adds a Cohort Analysis link to each of your campaigns. Click on this link to go to the analysis page.
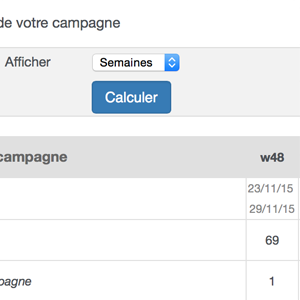
Choose to analyze your campaign by :
- Weeks
- Month
- Quarters
And confirm
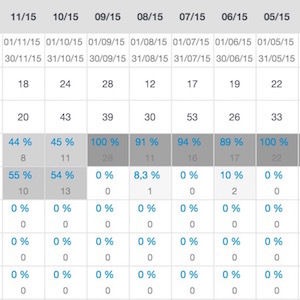
The app then displays a table whose columns are the "cohorts" or "generations" of customers/prospects classified according to their date of entry into the campaign. The rows of this table represent the stages in your sales process (sales pipeline).
For example, you'll see that 22% of your September leads are at the customer stage, while only 15% of your October leads are at the customer stage.
This table reflects your sales progress according to the age of your prospects.
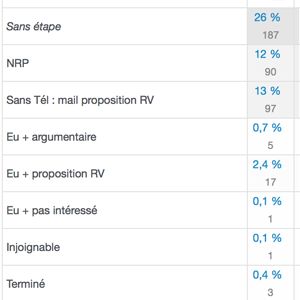
Click on the percentage in a table box and look under the table to see the list of contacts concerned.