Do you sell your products in stores, on the web or factory direct?
You have one or more stores, one or more sites and would like an analysis of daily sales by sales channel, to measure the performance of your points of sale?
With the"Multichannel sales analysis" app, track your sales and their evolution on a daily basis, broken down by channel.
Analysis by sales channel allows you to see your sales by week, with details by day, and to compare sales at D-7, M-1, Y-1.
Activating the app adds a new daily sales tracking dashboard to your application.
This dashboard displays :
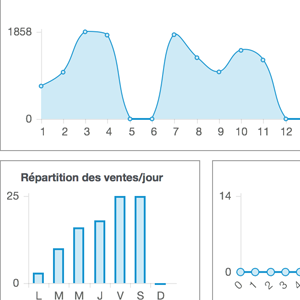
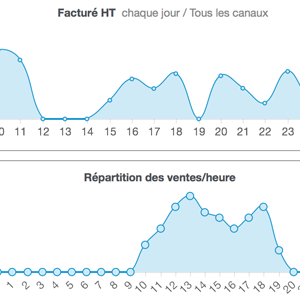
- Graphs tracking daily sales
- Tables detailing sales by channel and their evolution
The display selection area allows you to define :
- Display period
- Channel(s) to be analyzed and compared: All channels, all points of sale or selection of one in particular, all websites or selection of one in particular, and others
- Content to be displayed: graphics or detailed tables
Each period is expressed through a block representing a calendar week and contains :
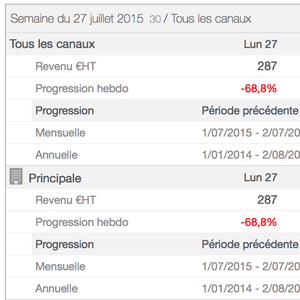
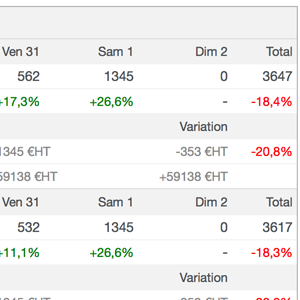
- Daily sales figures and weekly totals, totals and details by channel
- Sales growth (in %) in total and by channel: by day, by week, by month, and by year.
The progresision analysis allows comparison with the D-7 or M-1 period:
- D-7 = change compared to the same day of the previous week for the same sales channel
- M-1 = change compared with the previous month, for the same sales channel.
A comparison with the previous year is also proposed. The reference period for period -1 is indicated.