To help you manage your business more effectively, you'd like to be able to find your key indicators at a glance:
- Measuring financial or operating results (sales, breakdown by salesperson, by export zone, by product category, total expenses for a given financial category, etc.)
- Quality of actions carried out or customer perceptions (number of prospects in R1 or Closing on a campaign, number of customers with a given criterion in a personalized field, etc.)
Build your own performance indicators with the "Dashboards" app!
Transform your queries, created with the "Analytics" app, into indicators. Retrieve your indicator tables to track and measure your company's results against your objectives.
Activating the app adds a "Dashboard" function to the "Piloting" menu to access the list of built indicators.
1. Create an indicator
To create an indicator :
- Go to the "Analytics" sub-menu in the "Control" menu
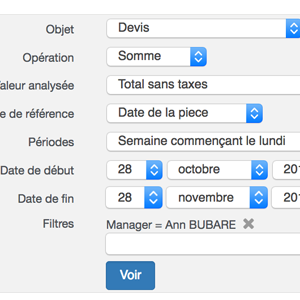
- Perform a query on an object, refining with filters
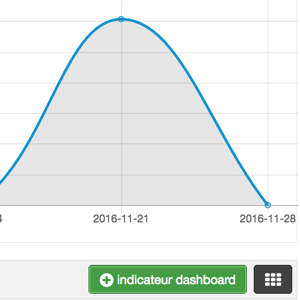
- Click on "View" to display the result
- Then turn this query into an indicator. To do this, click on the "+ Dashbord indicator" button in the query result block.
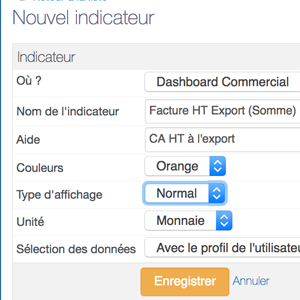
On the page that appears, configure your indicator
In the :
- Where: Specify the location of the indicator, i.e. the page on which you will find this block of information (Sales Dashboard, Production Dashboard or new Dashboard, etc.).
- Indicator name: Specify the name you want to give your indicator
- Help: Add an optional internal description
- Color: Indicate the color of your block on the page
- Display type: Numerical or graphical
- Unit: Indicate whether the unit of analysis is "currency" or "number".
- Operation with indicator: If the indicator results from an operation between the value obtained and another indicator. In this case, select the operation and the corresponding indicator.
Comparison: To display a comparison with the previous month, previous year, etc... - Estimate display: To integrate an estimate for the period produced by the software based on data from previous periods.
- Data selection: 2 options are available to define how the indicator is calculated.
- Either "The logged-in user's profile" = Data is calculated according to the authorizations of the user consulting it
- Either "Your user profile" = Data is calculated on the basis of the data accessible by your profile and visible to anyone authorized to consult it.
Confirm to save the indicator
2. View Dashboards
By default, each user has a number of standard dashboards (Sales, Purchasing, Teams, etc.) which are specific to that user. These dashboards can be accessed via the "Steering" menu, then "Dashboards".
From the Dashboards list, select "My standard dashboards" in the "Type" field, then click on "Search".
However, if it is not installed, it will not be possible to create additional dashboards.
You have a link to view the dashboards:
- On the Dashboards app home page
- On the incwo application home page to view them instead of the default display.
- From the "Steering" menu, then "Dashboards".
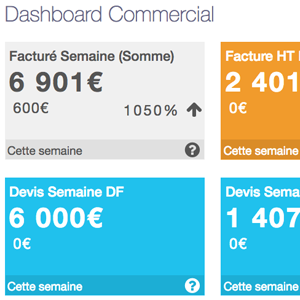
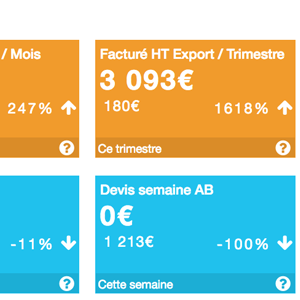
On each indicator, you will find :
- The value for the current period
- The value for the previous period
- The rate of change
3. Delete an indicator
On the indicator display page, clicking on the icon (?) displays a trash can, allowing you to remove the indicator from your dashboard.
4. Authorize Dashboard access
In the app's authorization settings, you specify the permissions for each user: all dashboards, his created or assigned dashboards, his dashboards only, and so on.
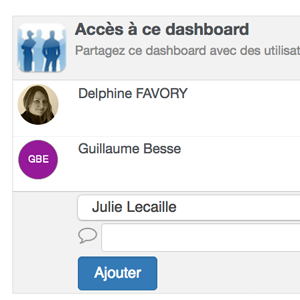
To add permissions for viewing a dashboard, go to the dashboard page, and in the "Access to this dashboard" block, add the list of additional people authorized to view the information block. To access it, they will need to have at least "Its created or allocated data" authorization.
In this way, you can build an indicator, the result of which is calculated on the information accessible to a Manager profile, and give access to it to an employee.
5. Publish Dashboards
This app is compatible with the "Web publishing" app. If you have it installed, go to a Dashboard, and in the "Share URL" block on the right, click on "Publish". Your Dashboard will then have a responsive public URL to circulate by email or SMS.
6. Related apps
The Analytics app is required to use the Dashboards.
Without Analytics, the analyses based on the indicators cannot be performed.