Do you set sales targets in terms of volume and value and want to monitor their results?
To optimize your sales activity, you have prospecting and loyalty objectives and would like to compare your ambitions and results in terms of: New daily contacts ? Daily calls? Quotations or proposals sent? Order renewals? Number of orders in a sales campaign?
Would you like to track financial, sales or even production indicators to measure your company's growth and performance?
Track your business performance indicators with the "Gestion par Objectifs" app!
Define your objectives, by week, month or quarter, and enter or automate your results for each period. Choose from a catalog of 120 pre-set indicators.
Take stock of the key factors behind your success or analyze your counter-perfomances and their impact over time!
Activating the"Management by objectives" app, adds to your application, in the"Dashboards" tab, a "Steering" section with a"Key indicators" menu.
This menu allows you to :
- Define your key indicators and targets (sales, customers, expenses, etc.).
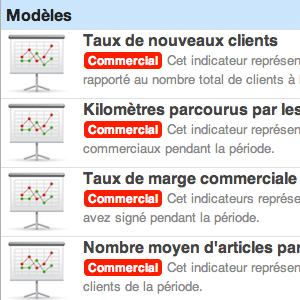
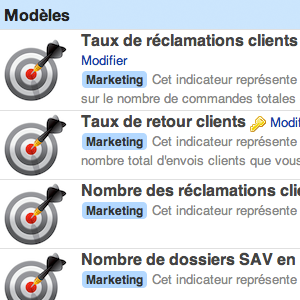
- Choose from a catalog of 120 indicators, or add your own
- Enter data yourself or by a designated collaborator: weekly, monthly or quarterly
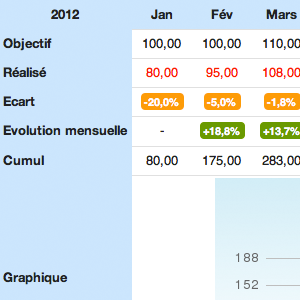
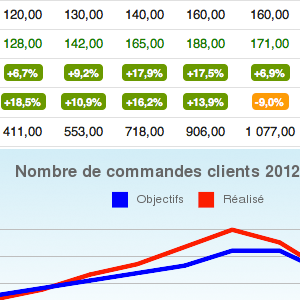
- Track the evolution of your indicators and the gap between your performance and your objectives, thanks to graphical analysis charts and curves.
When the due date arrives and your indicator needs to be entered, you'll receive an email notification.
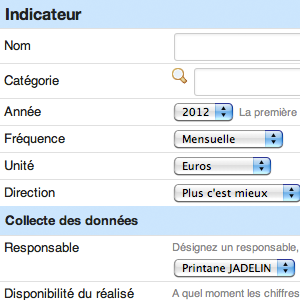
To create an indicator :
- Click on"add a new indicator".
- Give your indicator a name or select it from the 120 in the catalog
- Identify the year for analyzing your performance
- Define the frequency of information reporting: weekly, monthly or quarterly
- Indicate the performance measurement unit: a percentage, a number (quantity) or euros (for amounts and values).
- Describe the benefits of the indicator. In "Direction", indicate the direction to follow! Specify whether superior or inferior performance should be valued in relation to objectives, by selecting "More is better" or "Less is better". For example, for a sales objective "more is better" is generally chosen. For a "customer service returns" objective, "less is better" is more appropriate.
- Select whether the calculation of realizations is manual or automatic. If automatic, select the corresponding dashboard indicator, otherwise define the indicator manager, as well as the data entry and notification period information.
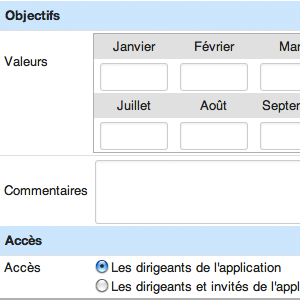
Add the target value for each period. Click on "Save".
You can then enter your first results and discover your tracking table and analysis graph.