Would you like to analyze the breakdown of your sales by product? or product category?
With the "Product Analysis" app, track the quantities and/or amounts of products sold by period.
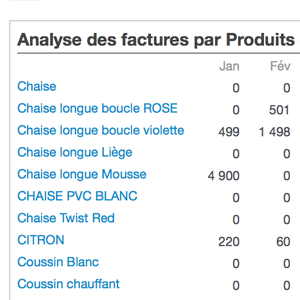
This table, which analyzes your sales by product, details the amounts and quantities of products per month (sales) for each of your products or product categories. You can also export this table.
Activating the app adds a new dashboard to your application.
It is added to the "Sales" menu, then to the "Invoices" module, in the list of analyses proposed for invoicing.
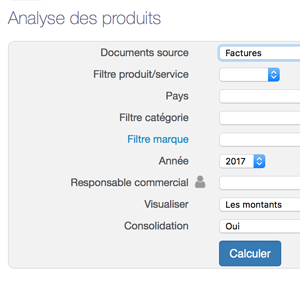
This dashboard displays a list of sales by product or product category:
- Depending on the type of source document selected: invoice, quotation, etc.
- Per month, over 12 months, over the expected period (calendar or fiscal year)
- In value
- In quantity
- Average monthly value or quantity
- Sort by: product or product category
Plus points Product sales: this analysis table gives you a breakdown of product sales:
- By customer: in the "Consolidation" field, select "Display third parties by third parties".
- By country: by selecting a country, you can track sales in that particular country.
- By item type, only products or services
- For a specific customer or sales manager
This dashboard can also be exported in Excel format.